
Building Cloud-Native
GIS Workflows with GeoLibre

go.gishub.org/geolibre-slides-enOne thread through my open-source work: fewer steps between people and geospatial tools

geemap
Earth Engine in Python and Jupyter
leafmap
Interactive mapping, no cloud vendor required

samgeo
SAM applied to remote sensing imagery

GeoAI
Deep learning toolkit for geospatial data
GeoLibre
A full GIS anyone can just open
GeoLibre · A cloud-native GIS that runs everywhereFour parts
01
Why cloud-native geospatial
Three shifts: formats, protocols, runtimes
02
What GeoLibre is
Scope, stack, and the platforms it ships on
03
Capabilities and live demos
Seven real cases, from loading data to AI segmentation
04
Lessons from open source
What actually drives adoption
GeoLibre · A cloud-native GIS that runs everywhereFour points of friction in the traditional workflow
Download as a toll gate
To look at the buildings in one county, you first pull a 40 GB national archive. Disk, bandwidth, and time are spent before the data is even in hand.
Formats as islands
Ten-character field names, encoding surprises, a 2 GB ceiling per file. Thirty years on, Shapefile still costs practitioners real hours.
Servers as cost
Publishing one web map means GeoServer, PostGIS, a tile cache, and someone to keep them alive. For a lab or a small agency that is a hard barrier.
Software as a barrier
Installers, licences, versions, and GPU drivers are genuine obstacles in a teaching lab, on a locked-down network, or on a borrowed laptop.
GeoLibre · A cloud-native GIS that runs everywhereCloud-native geospatial: leave the data where it is, read only what you need
Object storage
The data simply sits on static storage such as S3, GCS, or Azure Blob. No GIS server software is running anywhere.
HTTP range requests
HTTP already lets a client say "just bytes 1024 through 8192 of that file". A twenty-year-old part of the spec is the foundation of all of this.
Self-indexing formats
The file is chunked and indexed internally, so reading a few tens of KB of header tells the client exactly which byte range it wants.
Put together, they turn a file itself into a randomly addressable database.
Opening a 100 GB dataset stops meaning "download 100 GB" and starts meaning "issue a few dozen range requests and pull back a few MB".
GeoLibre · A cloud-native GIS that runs everywhereThe cloud-native formats
| Format | Replaces | Key mechanism | Typical use |
|---|---|---|---|
| COG | GeoTIFF + image server | Internal tiling + overview pyramid | Satellite imagery, DEMs |
| GeoParquet | Shapefile / File GDB | Columnar + row-group stats + bbox | Massive vector, attribute analysis |
| PMTiles | Tile directory / tile server | Single-file tile archive + directory index | Global basemaps, vector tiles |
| STAC | Bespoke metadata per provider | One JSON catalog and search API | Imagery discovery and time series |
| Zarr / Icechunk | Large NetCDF / HDF files | Chunked N-D arrays + versioned commits | Weather, ocean, data cubes |
| FlatGeobuf | GeoJSON | Streamable binary + packed R-tree | Mid-size vector, streamed |
| Apache Iceberg | Classic warehouse tables | Table format + manifests + snapshots | Enterprise spatial data lakes |
GeoLibre · A cloud-native GIS that runs everywhereWhat actually happens on one read
GeoLibre · A cloud-native GIS that runs everywhereThe browser became a real compute platform
WebAssembly (WASM)
C, C++ and Rust compile to near-native speed inside the browser. GDAL-class algorithms and a full geoprocessing toolbox can finally move into a tab.
DuckDB-WASM + Spatial
A complete analytical database running in the page, issuing spatial SQL straight against remote GeoParquet, with column and row-group pruning for free.
WebGL / WebGPU
Rendering goes to the local GPU. Millions of features, point clouds, 3D tiles and raster reprojection all become ordinary interactive operations.
Local capability APIs
File System Access lets the browser read large local files directly, and Web Serial reaches an external GNSS receiver.
GeoLibre · A cloud-native GIS that runs everywhereFour things you do not need
No account
Open the page and it is ready. No sign-up, no quota, no trial period.
No server
No GeoServer, no database, no tile cache, and therefore nothing to operate.
No upload
Computation happens locally and data stays in the browser by default, which makes privacy and compliance straightforward.
No install
The web build installs nothing. Add the desktop app when you want more, and the interface is identical.
Where it is strong
Opening cloud-native formats instantly, in-browser analysis and SQL, fast cartography and sharing, teaching, and embedding into your own system.
What it is not
It is not a replacement for QGIS or ArcGIS. A few slides from now I will be specific about the relationship, and about the gaps.
GeoLibre · A cloud-native GIS that runs everywhereOne codebase, four layers
Rendering
MapLibre GL JS draws vector and raster basemaps, deck.gl handles 3D tiles, point clouds, Gaussian splats and large raster overlays. Both share one camera and one WebGL context.
Data
DuckDB-WASM Spatial reads most vector formats and provides spatial SQL. geotiff.js handles COGs and multiband imagery, and dedicated renderers handle Zarr and NetCDF cubes.
Analysis
A WebAssembly geoprocessing runtime carries 1,000+ tools. Turf.js covers light vector work, Pyodide runs GeoPandas in the page, and an optional Python sidecar adds GDAL and rasterio on desktop.
Shell
Tauri v2 packages the same React and TypeScript frontend as Windows, macOS and Linux desktop apps and as native iOS and Android apps, at a fraction of an Electron bundle.
GeoLibre · A cloud-native GIS that runs everywhereOne codebase, six form factors
Browser
web.geolibre.app
Nothing to install, and installable as a PWA that works offline.
Desktop
Windows, macOS and Linux installers, plus Mac App Store, Homebrew, winget, AUR and Flatpak.
Mobile
Native apps on the App Store and Google Play, built from the same codebase with Tauri v2.
Jupyter
pip install geolibre
The whole app as an anywidget in a notebook, with two-way project sync.
R
The geolibre R package for RStudio, Quarto, R Markdown and Shiny.
Embed / self-host
iframe embed, a versioned postMessage API and a typed client, plus Docker for private deployment.
GeoLibre · A cloud-native GIS that runs everywhereFour principles
- Local first. Computation happens on the user's device and data does not leave it by default. This is not a privacy switch you can turn off, it is what the architecture produces.
- Open formats first. The project file is human-readable
.geolibre.json. It goes in version control, scripts can write it, an AI can write it, and it locks nobody in. - Sharing is built in. Any project exports to a single offline HTML file that opens on a double click with no server, or becomes a link, or embeds into an existing system.
- Progressive enhancement. Every core capability works with no server at all. A Python sidecar or a self-hosted service adds on top of that, never the other way around.
GeoLibre · A cloud-native GIS that runs everywhereNext to QGIS and ArcGIS: complementary, not a replacement
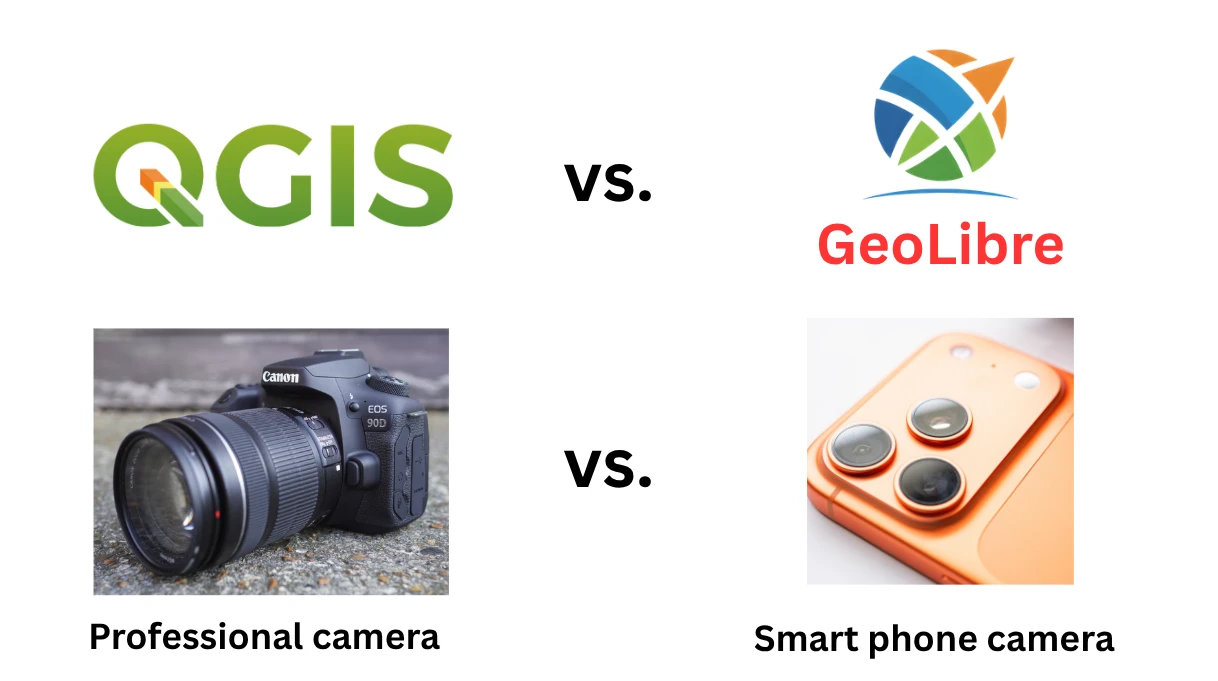
Pro camera and phone camera
QGIS is the professional camera: mature, powerful, extensible. GeoLibre is the phone camera: light, always at hand, shareable the moment you are done. Phone cameras did not replace pro cameras, they multiplied the number of people taking pictures.
Where the gaps honestly are
Plugin depth, decades of specialist tools, projection and topology edge cases, stability on very large projects. QGIS leads clearly on all of these.
And they interoperate
GeoLibre imports QGIS projects (.qgs / .qgz) and ArcGIS Pro projects (.aprx / .mapx), keeping layers, groups, styling and the view.
 GeoLibre · A cloud-native GIS that runs everywhere
Loading data, editing attributes, editing geometry
Loading
Drag a local GeoPackage, Shapefile, GeoParquet, FlatGeobuf, KML/KMZ, GPX, CAD drawing or OSM PBF onto the map. DuckDB-WASM Spatial parses it in the browser and reprojects it to WGS84.
Attribute table
Sort, filter, multi-select highlighting, field calculator, virtual fields (expression-backed columns), attribute joins, editor tracking, plus built-in histogram, scatter and box charts and field statistics.
Symbology and labels
Single, categorized, graduated, expression and rule-based renderers, proportional symbols, heatmaps, clustering and diagram symbols. The legend is generated from the symbology, and styles import and export as SLD, QML or Mapbox style JSON.
Geometry editing
The GeoEditor plugin does topological digitizing (a polygon shares its neighbour's edge, so no slivers or overlaps), pulls the features in the current view into the editor, and writes edits back to GeoPackage, GeoJSON or PostGIS.
GeoLibre · A cloud-native GIS that runs everywhereWhy 100 GB of vector data pans smoothly in a browser
1 Column pruning
GeoParquet is columnar. Rendering building height reads the height and geometry columns only. The other dozens of columns are never transferred.
2 Row-group pruning
Every row group carries its own bounding box and statistics. DuckDB reads the metadata first and skips whole row groups that miss the current view.
3 Fetch only the hits
What survives is fetched as byte ranges, then decompressed, decoded and rendered entirely inside the browser.
Performance is set by the features in the current view and the columns you asked for, not by the size of the dataset.
That is the whole reason streaming a 100 GB dataset works, and there is no magic in it. The real ceiling is tab memory, which limits how many features are resident at once, not how big the dataset is.
GeoLibre · A cloud-native GIS that runs everywhereStreaming 100 GB of vector data live
The data
Overture Maps global buildings, transportation, places and divisions, plus open GeoParquet datasets on Source Cooperative, all hosted as plain files on object storage.
On screen
Open the Overture plugin, pick the buildings theme, zoom to a city, and watch features stream in with the viewport. Open the network panel and you see a series of range requests, not one bulk download.
Then analyze it
Switch to the SQL Workspace and write spatial SQL against that same remote GeoParquet: filter by area, join to another layer, aggregate, and add the result as a new layer.
Three engines
DuckDB Spatial by default, PGlite for in-browser PostGIS, and Apache Sedona, switchable in the same panel. Apache Iceberg tables are supported too.
GeoLibre · A cloud-native GIS that runs everywherePMTiles: one file instead of a tile server
What it solves
Vector tiles are usually either millions of small files or a running tile server. PMTiles packs the pyramid into one file with a built-in directory, and the client range-requests the tile it needs.
What that means
A global basemap can live on a CDN, on object storage, even on GitHub Pages. Zero operations, unlimited concurrency, and you pay for traffic rather than for servers.
How GeoLibre handles it
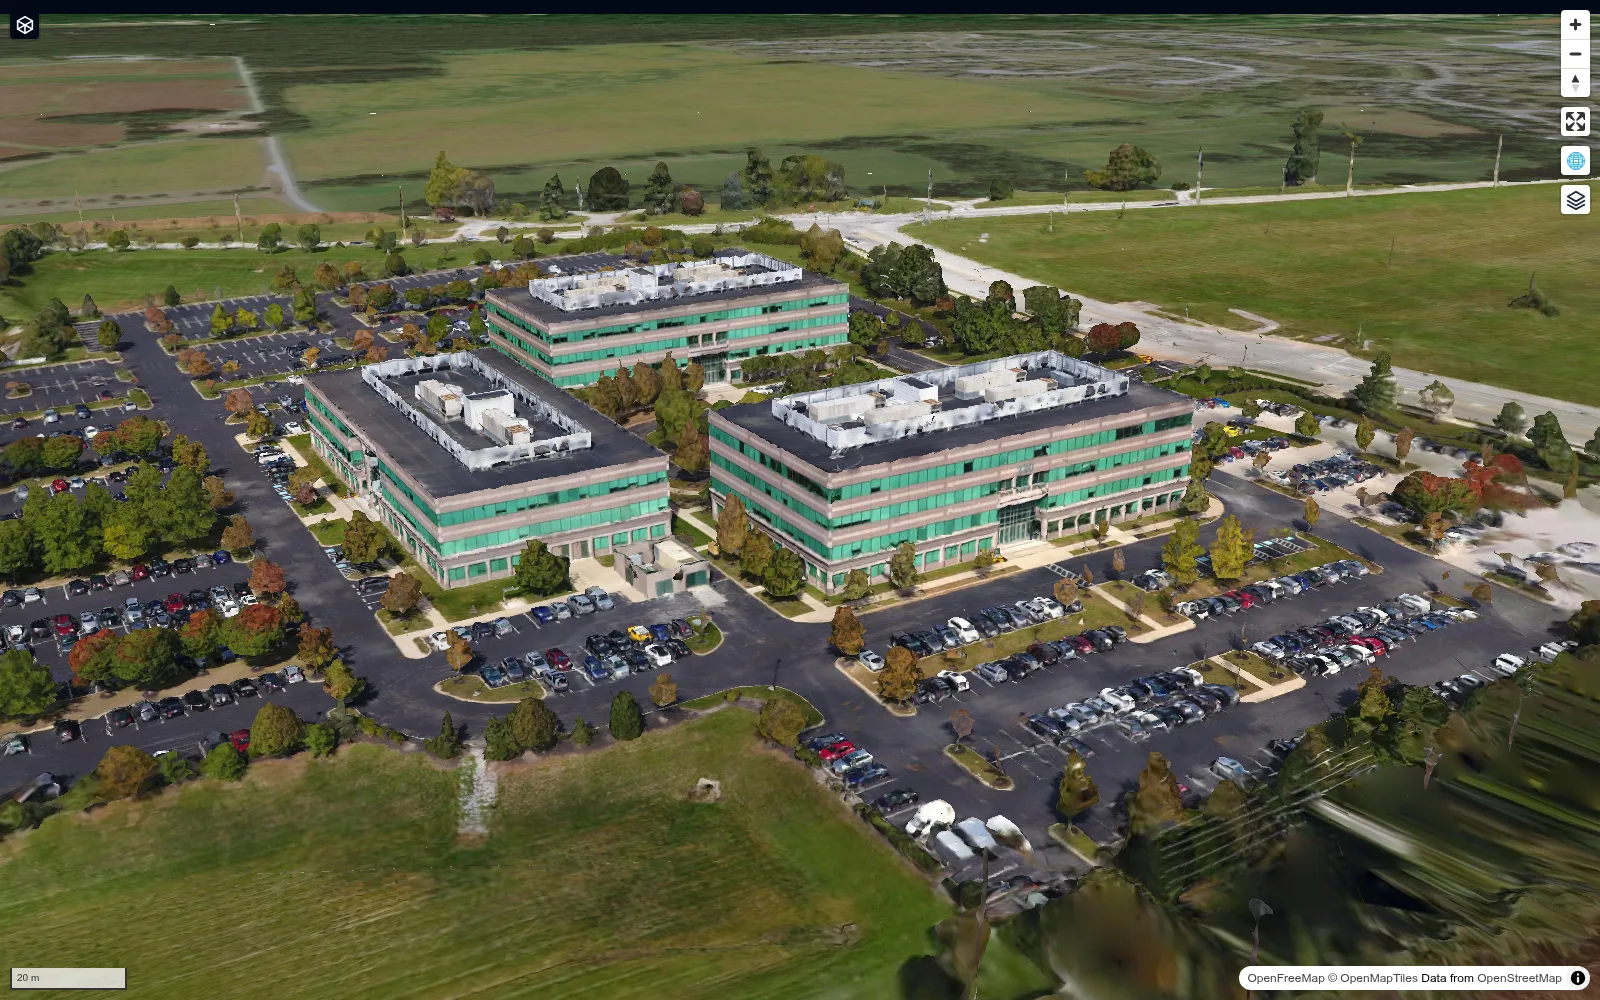
A vector tile layer holds no local features, so the Style panel samples the features the viewport already loaded to fill in fields and value ranges. Categorized and graduated styling and 3D extrusion still work.
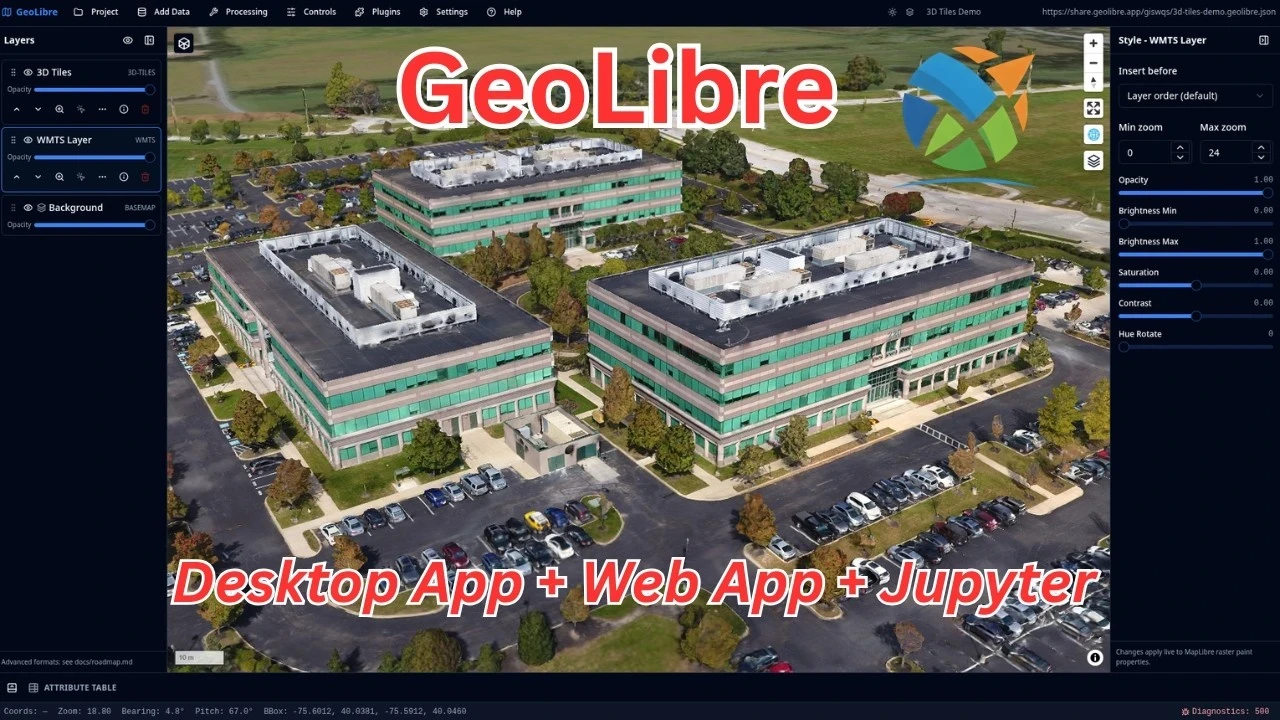
GeoLibre · A cloud-native GIS that runs everywhere3D Tiles, point clouds, and real 3D scenes
- 3D Tiles: photogrammetry and mesh datasets stream in and render on deck.gl over the MapLibre map, including authenticated tilesets via custom headers.
- LiDAR point clouds: COPC and LAZ coloured by elevation or classification. The USGS LiDAR plugin clips to an area of interest and downloads COPC.
- ArcGIS I3S scene layers (Integrated Mesh and 3D Object) render on deck.gl as well.
- Gaussian splats, glTF/GLB models placed at coordinates, and georeferenced video overlays.
- Terrain-aware measurement in 3D, with a great-circle initial bearing and a 16-point compass label.
 GeoLibre · A cloud-native GIS that runs everywhere
NYC buildings and subways: the camera holds still, the data grows
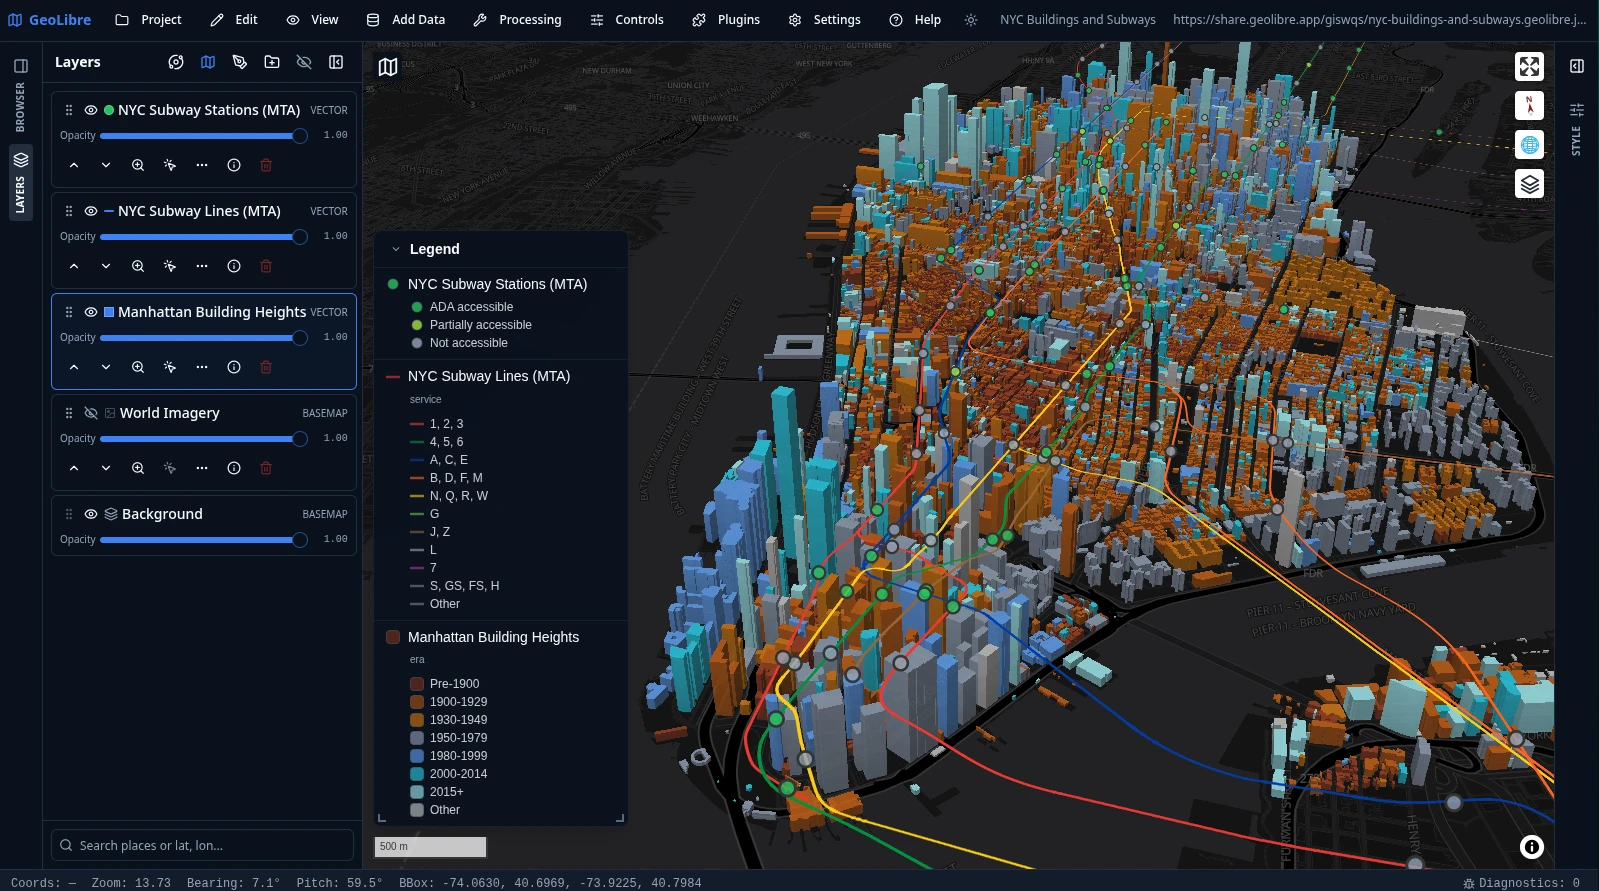
What is in this map
Manhattan footprints extruded in 3D and coloured by construction era, with MTA subway lines on top. The legend is generated automatically from the symbology.
The time slider
Running construction year from 1850 to 2025 fills Manhattan in era by era. The timeline drives GeoJSON, vector tiles, PMTiles, COG sequences and Zarr cubes alike.
Open it yourself
A real share link: share.geolibre.app/giswqs/nyc-buildings-and-subways
GeoLibre · A cloud-native GIS that runs everywhere1,000+ geoprocessing tools, all running in the browser
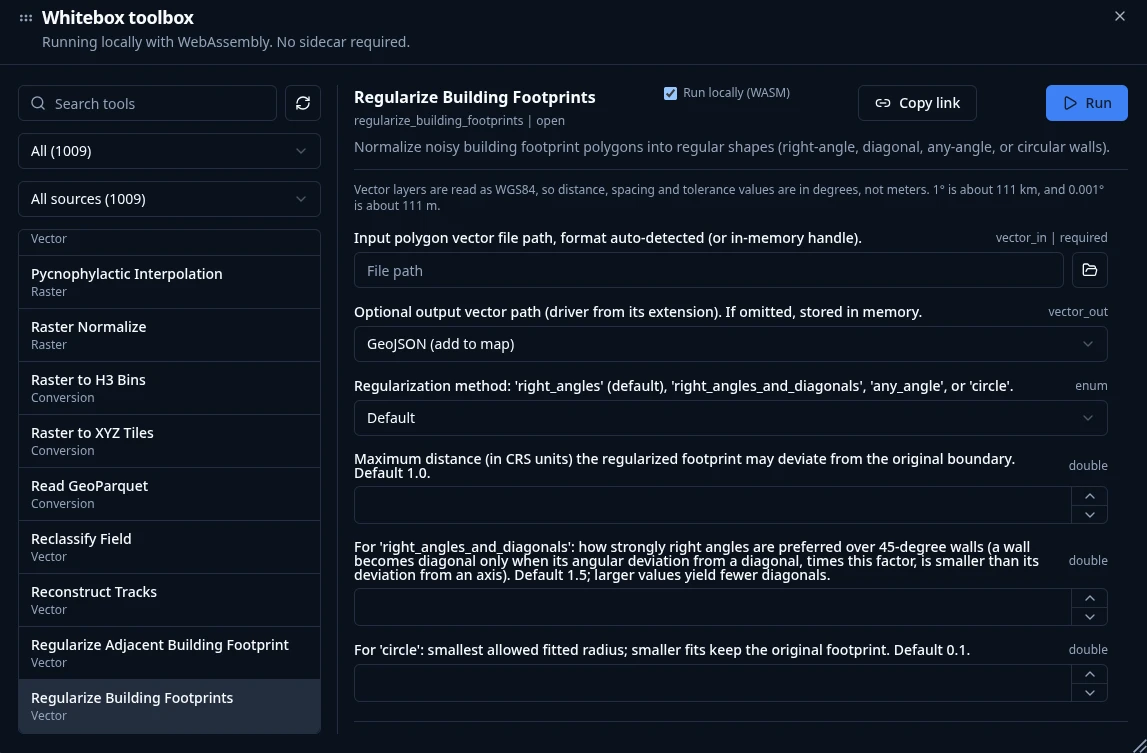
| Category | Tools | Examples |
|---|---|---|
| Vector | 313 | overlays, buffers, joins, topology, generalization |
| Raster | 256 | algebra, filters, reclassification, zonal statistics |
| Remote sensing | 154 | spectral indices, band math, classification, change |
| Hydrology | 100 | depression filling, flow direction, accumulation, basins |
| Terrain | 99 | slope, aspect, hillshade, curvature, viewsheds |
| LiDAR | 65 | filtering, ground classification, DEM/DSM generation |
| Conversion | 49 | to GeoParquet, PMTiles and COG |
| Network | 26 | connectivity, cost distance, routing |
GeoLibre · A cloud-native GIS that runs everywhereModel Builder: tools wired into a reusable graph
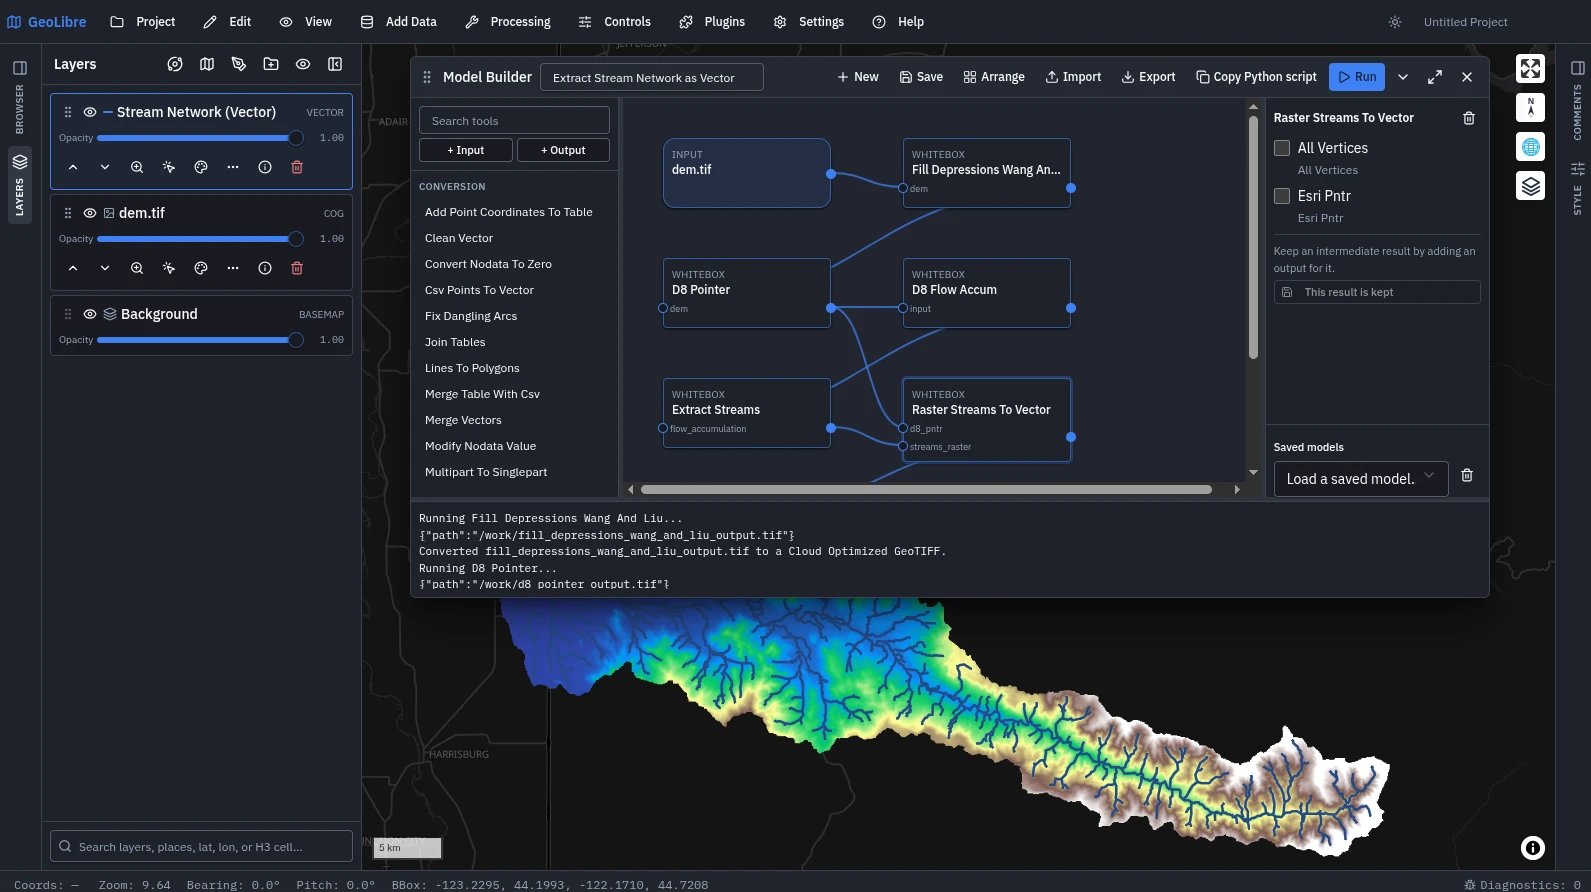
dem.tif to depression filling, D8 pointer, flow accumulation, stream extraction, then raster to vector, in one runAn ArcGIS-style canvas
Drop tools as nodes and wire one tool's output into the next tool's input. Any intermediate result can be kept as an output when you want it.
Validated before it runs
Cycles, missing connections and wrong parameter types are reported before execution. Models save, reload, import and export, and copy out as Python.
AI can author the model
Describe the workflow in plain language and the assistant produces a validated graph for review before it runs. All on WebAssembly, no server involved.
GeoLibre · A cloud-native GIS that runs everywhereSamGeo: one prompt turns imagery into vectors
This exact run
Image uc_berkeley.tif, text-prompt mode, model facebook/sam3.1, prompt is the single word building, threshold 0.5. One run returns 375 building features.
Four ways to prompt
Text prompts, foreground and background points clicked on the map, a box dragged to find similar objects, and SAM 2's automatic mask generator.
Being clear about where it runs
Results arrive as a GeoJSON layer with a per-feature score, ready for the attribute table and export. Inference runs on a separate samgeo-api service (GPU recommended), the only demo today that needs one.
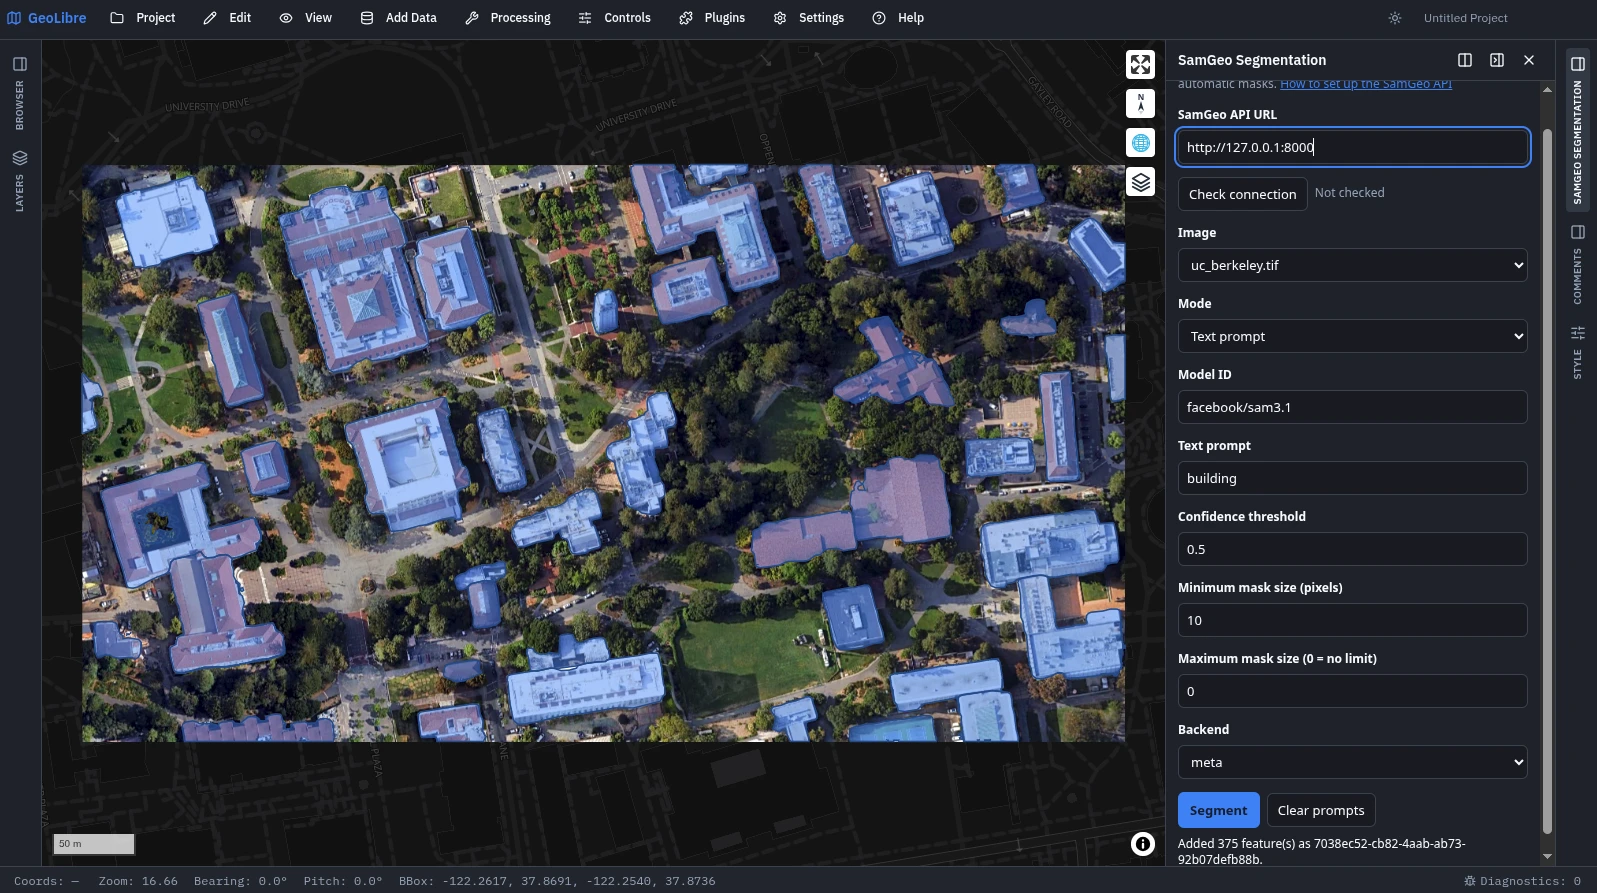
building, masks in blueGeoLibre · A cloud-native GIS that runs everywhereSQL Workspace and Processing History
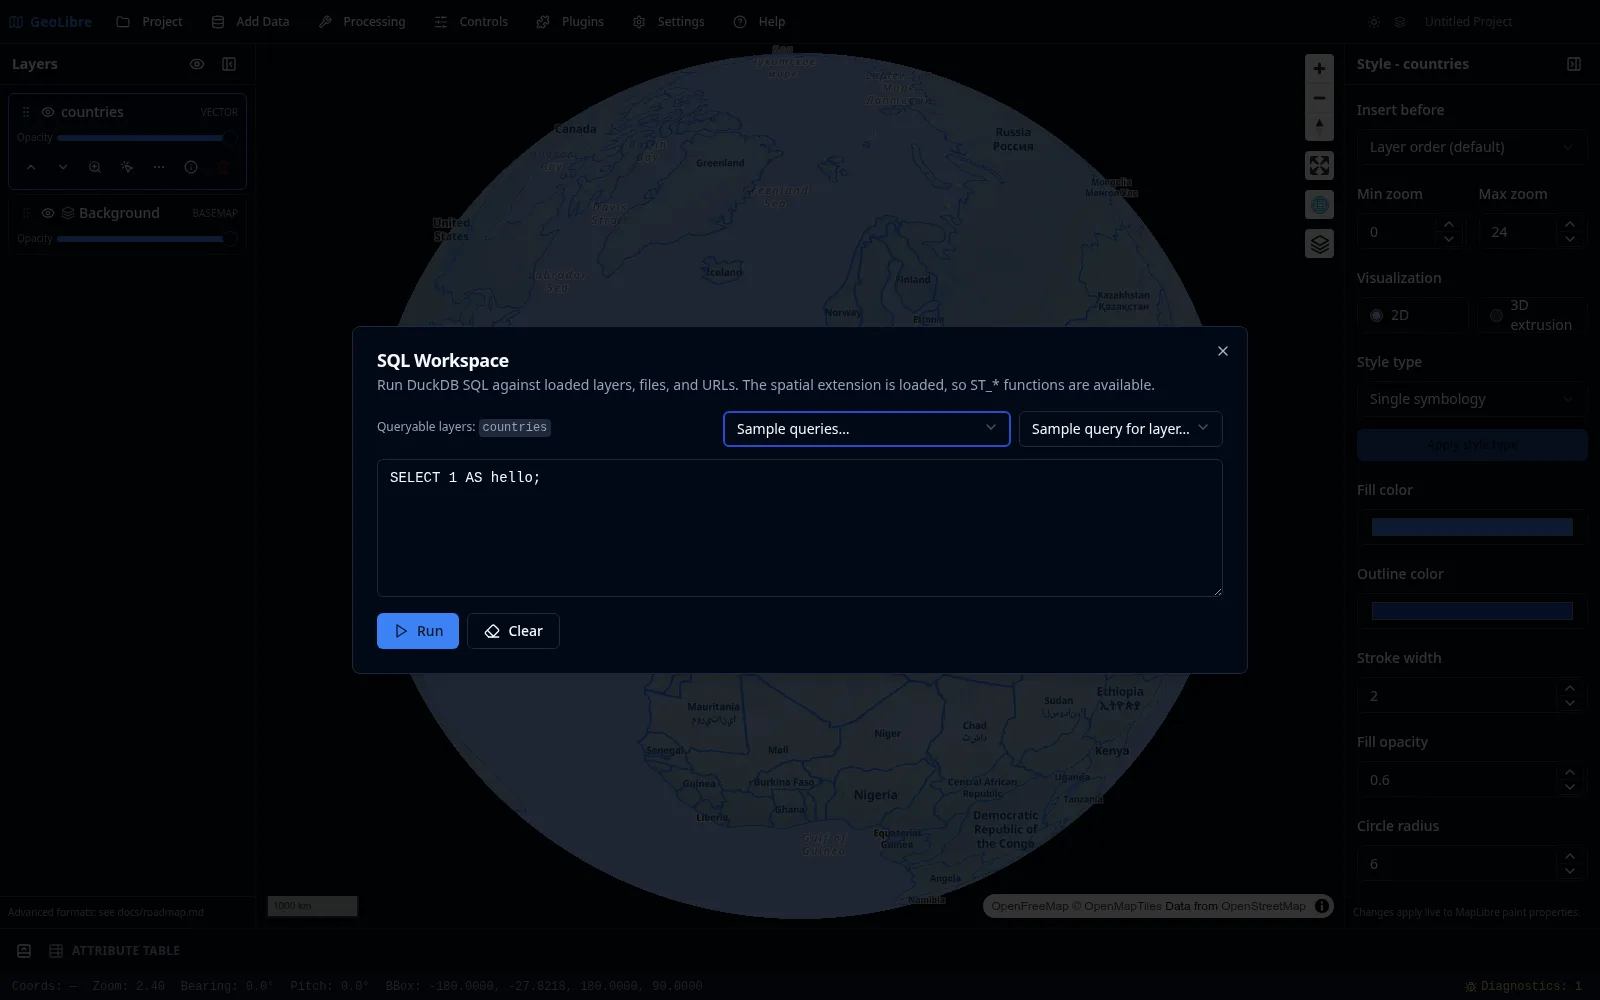
SQL Workspace
DuckDB spatial SQL against loaded layers, local files and remote URLs, with table and column autocomplete, sample queries and query history. Results add to the map or export.
Database engines
Besides DuckDB Spatial there is PGlite (PostGIS) and Apache Sedona, both in the browser. Apache Iceberg tables read their CRS from the schema and report true row counts from the manifests first.
Processing History
Every tool run is recorded, re-runnable with one click, and copyable as the equivalent Python for the Notebook panel or JupyterLite.
 GeoLibre · A cloud-native GIS that runs everywhere
Plugins: the app is extensible from outside
Map capability plugins
Swipe compare, time slider, H3 and DGGS grids, elevation profile, directions, Street View and Mapillary, atmosphere and deep-space effects, flight simulator, map recording.
Data catalog plugins
STAC catalogs and APIs, NASA Earthdata GIS, Planetary Computer, Overture Maps, Source Cooperative, Hugging Face, Natural Earth, GeoLens.
Analysis and editing
GeoEditor topological editing and building massing, USGS LiDAR clipping, SamGeo segmentation, GeoAgent.
What the plugin API allows
Registering right-rail panels, toolbar menus and floating panels; rendering on the host's own deck.gl instance and Zarr renderer; and querying a loaded layer's features read-only instead of re-fetching and re-parsing the source.
Distribution
A plugin.json manifest, zip install on desktop and web alike, build-time drop-in directories, and the registry at plugins.geolibre.app with version checks and one-click updates.
GeoLibre · A cloud-native GIS that runs everywhereOnce it is finished, how do you hand it over
Export as a single HTML file
The whole project becomes one offline HTML file that opens on a double click, with no server and no network. To a reviewer or a student it is just an attachment.
Share links and a readiness check
Before upload, every data source is probed and anything a recipient could not load is listed with the reason (needs credentials, no CORS headers, dead link, local path). It informs, it does not block.
Embed into your own system
maponly for a bare map, layout=viewer for read-only, ?data= and ?style= deep links, ?tool= straight to a tool, plus the versioned postMessage API.
 GeoLibre · A cloud-native GIS that runs everywhere
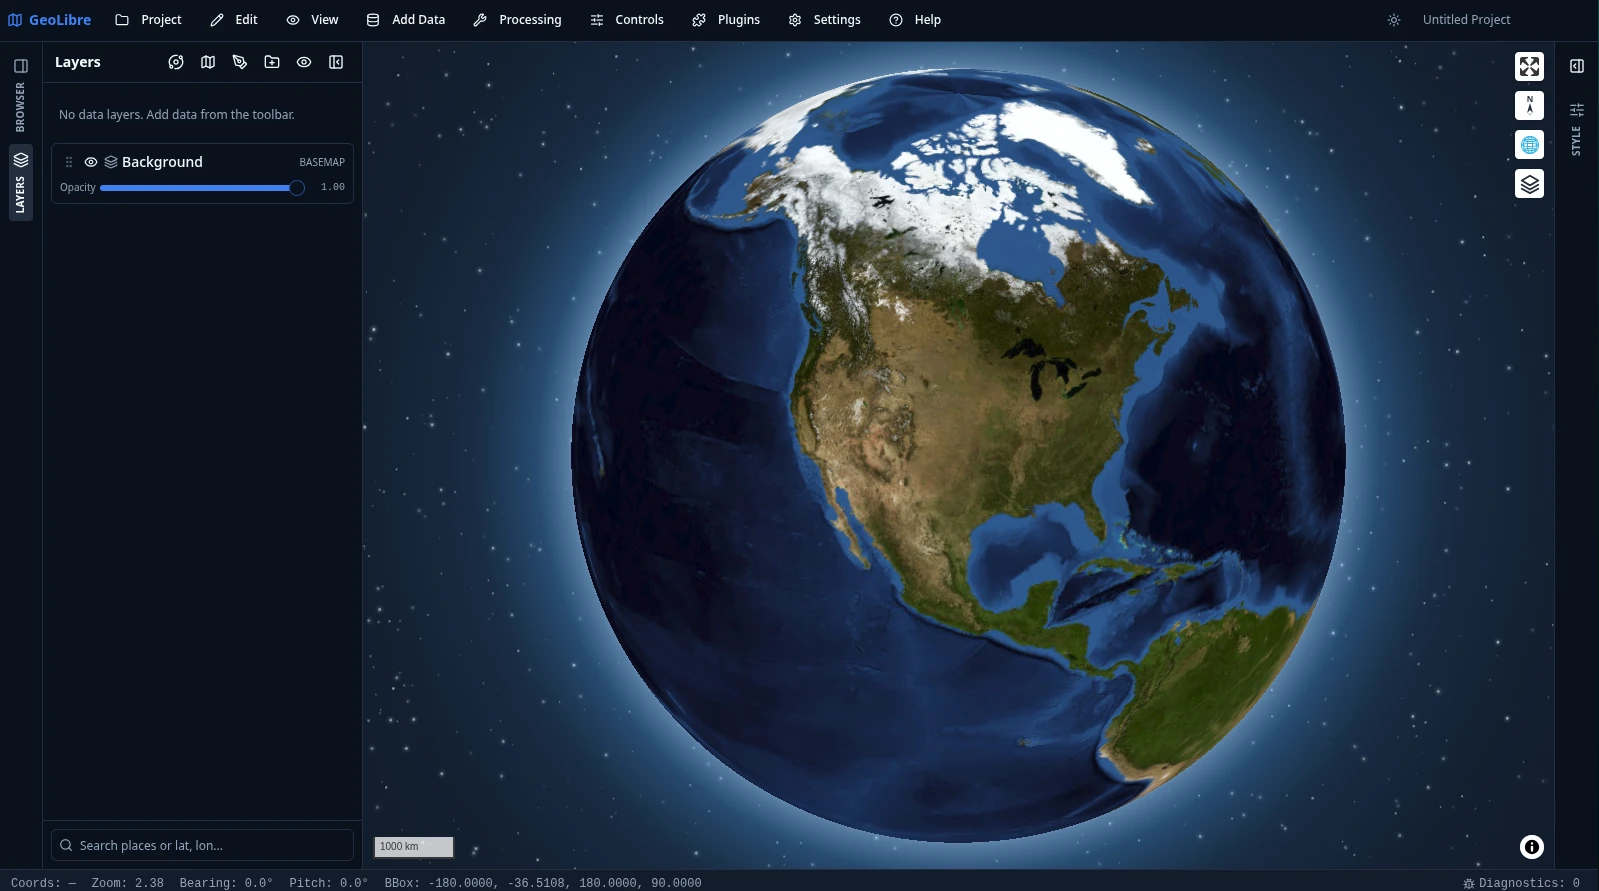
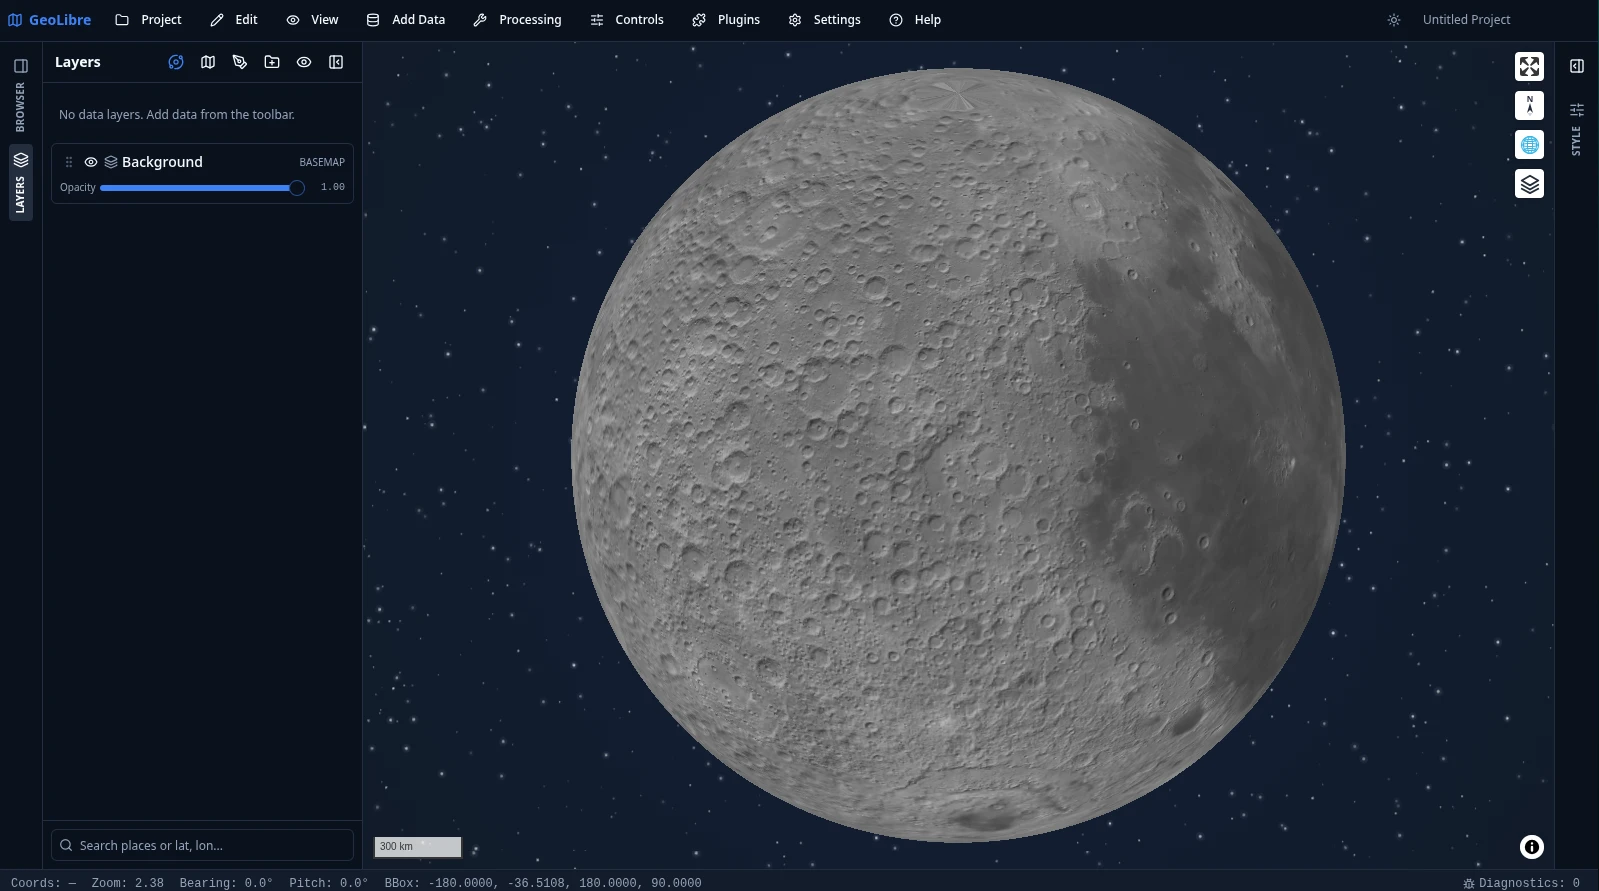
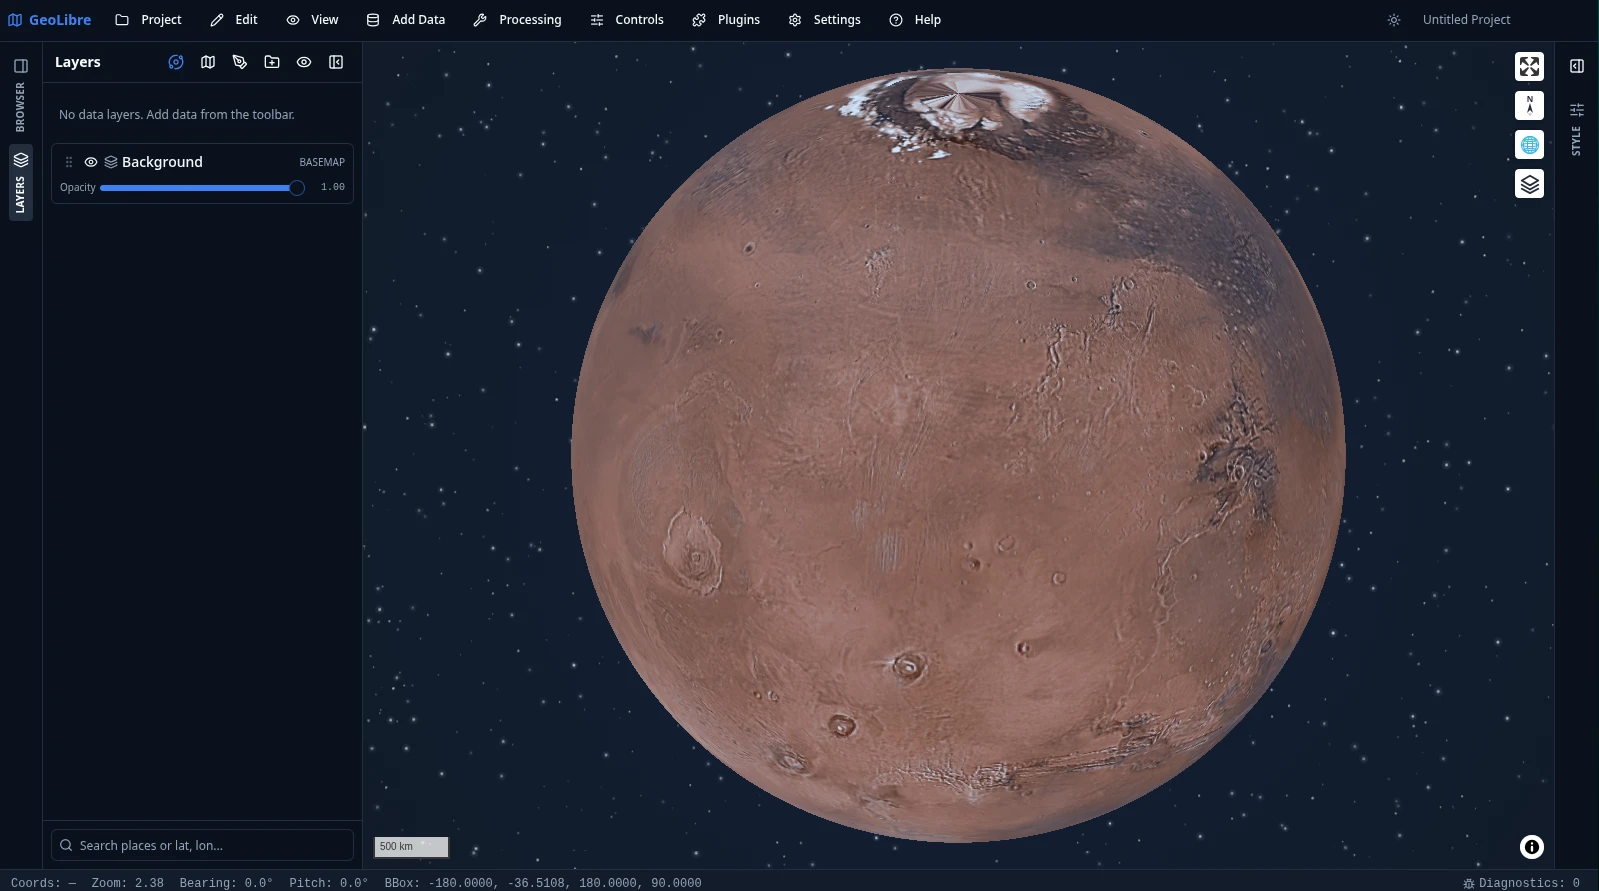
Not limited to Earth
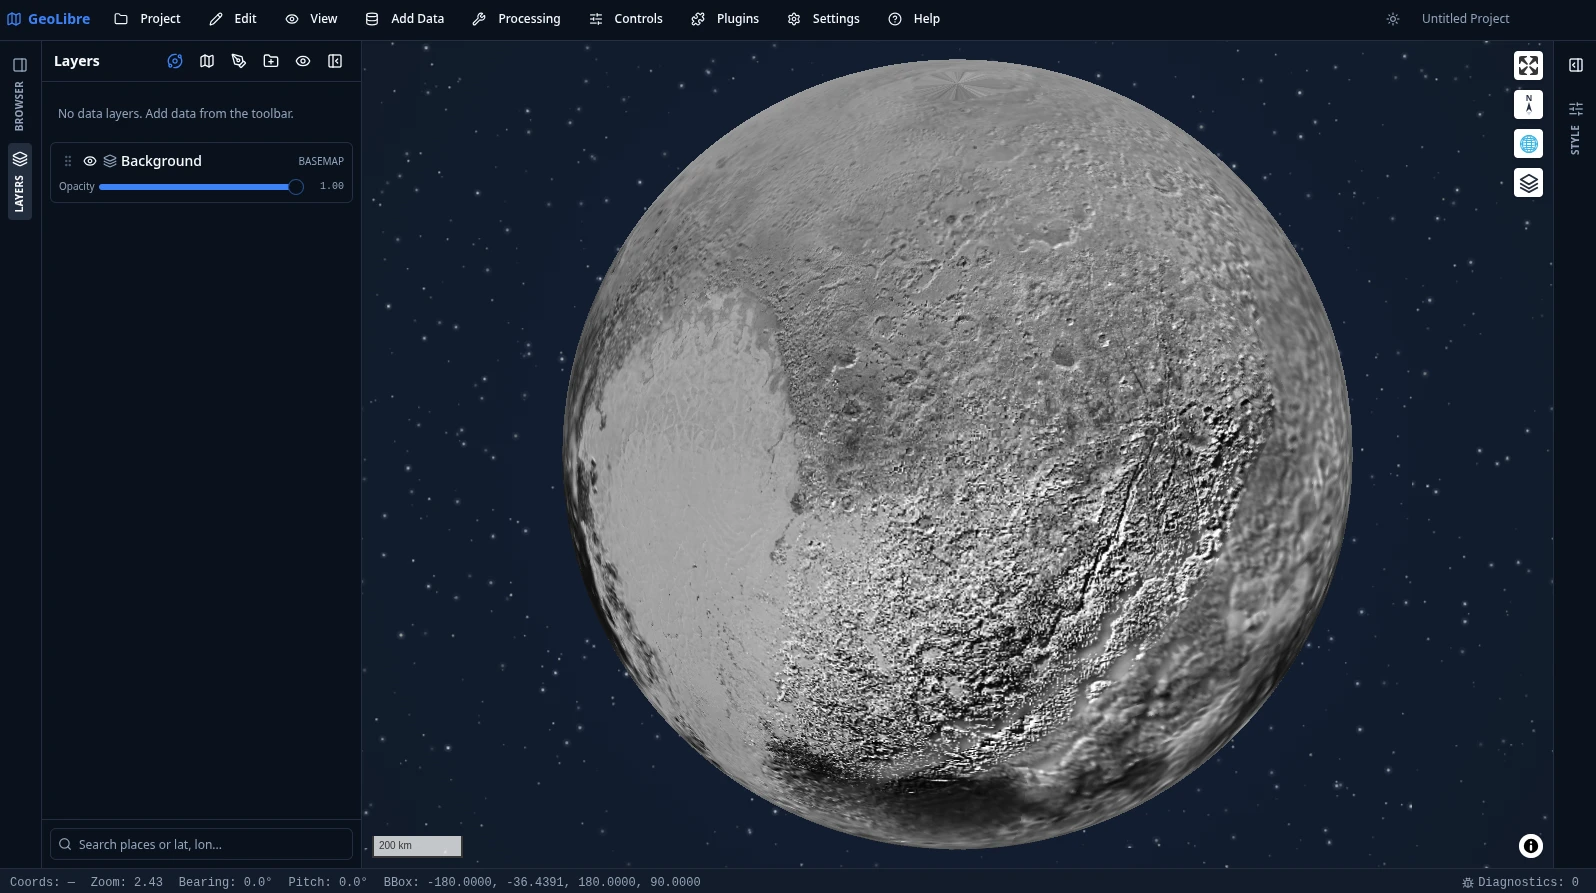
Planetary basemaps
The Moon, Mars, Mercury, Venus, Europa, Ganymede, Callisto, Titan, Pluto and Charon, from OpenPlanetaryMap and USGS Astrogeology.
The engineering point
Each project carries its own ellipsoid, so distance, area and scale measurements match the body being mapped. Basemap, projection and measurement are configurable rather than Earth hard-coded.
GeoLibre · A cloud-native GIS that runs everywhereCross-platform deployment and self-hosting
Docker on your own network
One command runs the web build in a container, with optional HTTP Basic Auth. GEOLIBRE_SHARE_URL and GEOLIBRE_COLLAB_URL point sharing at your own servers at container start, and off removes it from the UI entirely.
A fully isolated build
GEOLIBRE_NO_EXTERNAL_CDN=1 strips every external CDN reference and makes the few features that genuinely need a remote host say so up front rather than failing at the end of a run.
UI Profiles
Tailor which menus, panels and data sources a deployment shows, so a general-purpose GIS becomes a focused tool for one job, with no code changes and no fork to maintain.
Offline and localization
Installable as an offline-capable PWA, with a Download Offline Area tool that pre-caches basemap tiles. 18 locale catalogs, including right-to-left Arabic and Persian with a mirrored interface.
GeoLibre · A cloud-native GIS that runs everywhereOne lesson from each step
geemap
Earth Engine brought into Python and Jupyter.
Lowering the barrier to an existing powerful system is itself enormous value.
leafmap
Interactive mapping with no commercial cloud underneath.
Do not lock users to a single backend.
segment-geospatial
SAM applied to remote sensing imagery.
When a general model enters a domain, the interface decides adoption more than the model does.
GeoLibre
All of the above, made into an app you simply open.
Remove installation and the number of users changes by an order of magnitude.
GeoLibre · A cloud-native GIS that runs everywhereWhat actually drives adoption
- Free is necessary, not sufficient. What actually moves the needle is documentation, sample data, video tutorials, reproducible notebooks, and answering issues quickly.
- Distribution matters as much as code. A project on PyPI, conda-forge, CRAN, the App Store, Google Play, Microsoft Store, Homebrew, winget and AUR is a different project from one that is only a GitHub repository.
- Citability drives academic uptake. Every release gets a Zenodo DOI, so users can cite it properly in papers, and that feeds back.
- Worth saying plainly: GeoLibre's development pace owes a great deal to AI coding assistants. That is itself a real data point about open source and AI.
GeoLibre · A cloud-native GIS that runs everywhereWays to get involved
Use it and tell me
File issues, report bugs, request features. A clear description of a real workflow is often worth more than a patch.
Translations
18 locales ship today. Reviewing terminology in your own language is the easiest high-impact contribution there is.
Write a plugin
Build against the plugin.json contract. No changes to the main repository, and nothing to wait for a merge on.
Teach with it
Zero install means the lab machines, the borrowed laptop and the student's own device stop being obstacles. One link starts the class.
Pilot it at work
Docker on an internal network plus UI Profiles makes it cheap to try on one concrete workflow before committing.
Sponsor
GitHub Sponsors. The project is MIT licensed, and sponsorship funds development, hosting and cross-platform distribution.
GeoLibre · A cloud-native GIS that runs everywhereThree sentences
Cloud-native formats turn "open a 100 GB dataset" into a few seconds of work, at the cost of a few dozen HTTP range requests.
WebAssembly and DuckDB bring full spatial analysis into the browser, so privacy and performance stop being a trade-off.
GeoLibre packages both into a free, open-source, cross-platform, zero-install app you can open today.
For research and teaching
A zero-install classroom, a citable open-source tool, and reproducible notebook workflows.
For government and industry
Deployable on an internal network, data never leaves the machine, the UI can be trimmed, it embeds into existing systems, and MIT puts no limit on commercial use.
GeoLibre · A cloud-native GIS that runs everywhere
Questions
Try it now
Web app web.geolibre.app
Docs geolibre.app
Source github.com/opengeos/GeoLibre
Examples share.geolibre.app
Install and cite
Python pip install geolibre
Plugins plugins.geolibre.app
Licence MIT
Cite doi.org/10.5281/zenodo.20785400